
Infographic circular chart divided into 9 parts. Step-by step cycle diagram with nine options designed for report, presentation, data visualization.


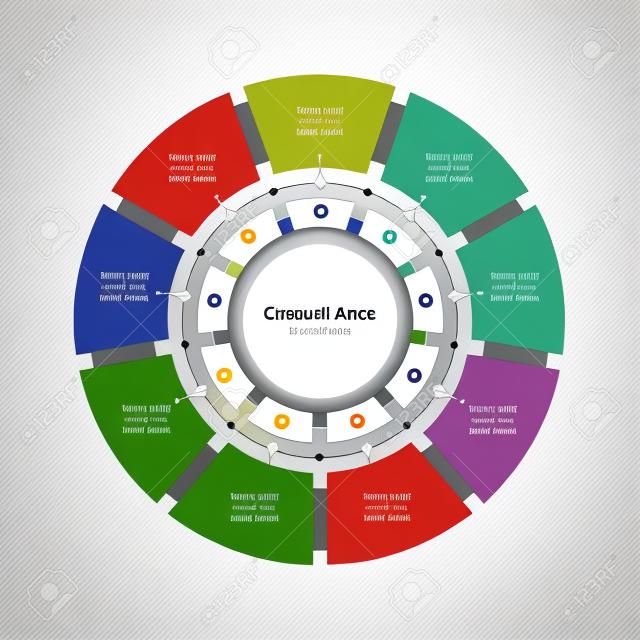
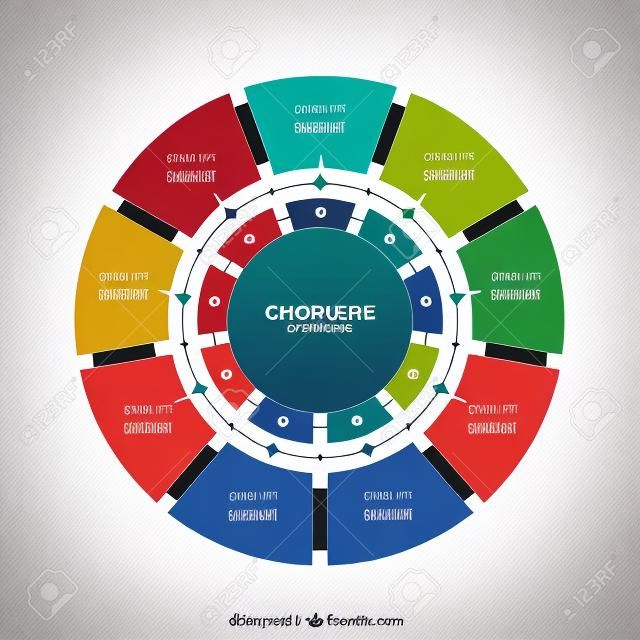
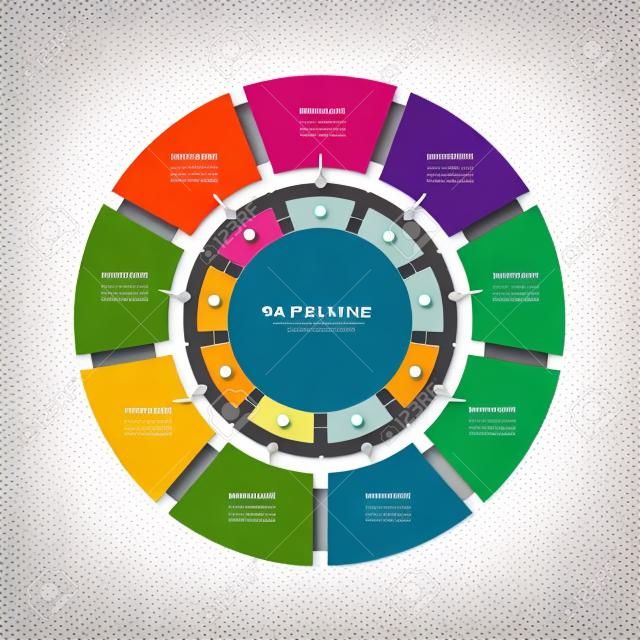
Infographic Design Elements for Your Business Vector Illustration. EPS10
 Pinterest
 146626708

 New
New
 New
New
 New
New


 146626708